BetterStack Monitoring
BetterStack provides comprehensive monitoring, logging, and uptime tracking for your applications. This guide will show you how to integrate BetterStack with your Rivet Actor to monitor performance and collect logs.
Notice
This guide only applies to Docker Actors.
Prerequisites
Before you begin, you'll need:
- A BetterStack account
- Your BetterStack API token
- The Rivet CLI installed
- Docker installed (for local testing)
How It Works
The integration uses Vector as a log collector and metrics shipper. Logs from your actor are piped to Vector, then forwarded to BetterStack. Vector also automatically collects system metrics to upload to BetterStack.
Setup Instructions
1. Create a BetterStack Account
If you don't already have one, sign up for a BetterStack account at betterstack.com.
2. Get Your BetterStack Credentials
From your BetterStack dashboard:
- Navigate to the Logs section
- Create a new source by clicking Connect source
- Select Logs + Metrics > Vector then click Connect source
- Note Ingesting host and Source token for later
3. Configure Your Project
Vector Configuration
Create a vector.yaml file in your project with the following configuration:
Tip
lobby_id is being used as an example to uniquely identify your actor. You can define your own custom identifier.
Dockerfile Configuration
Update your Dockerfile to include the Vector config & Vector binary.
Here is an example Dockerfile for a Node.js Actor:
Rivet Configuration
If you don't already have a rivet.json, you can use this:
4. Deploy Your Actor
Deploy your Actor to Rivet:
5. Pass BetterStack Credentials to Your Actor
When creating Actors, pass your BetterStack credentials as environment variables:
Viewing Logs and Metrics
Once your Actor is running with the BetterStack integration:
- Log in to your BetterStack dashboard
- Navigate to the Logs section to view your application logs
- Check the Metrics section to view performance data
- Set up alerts based on log patterns or metric thresholds
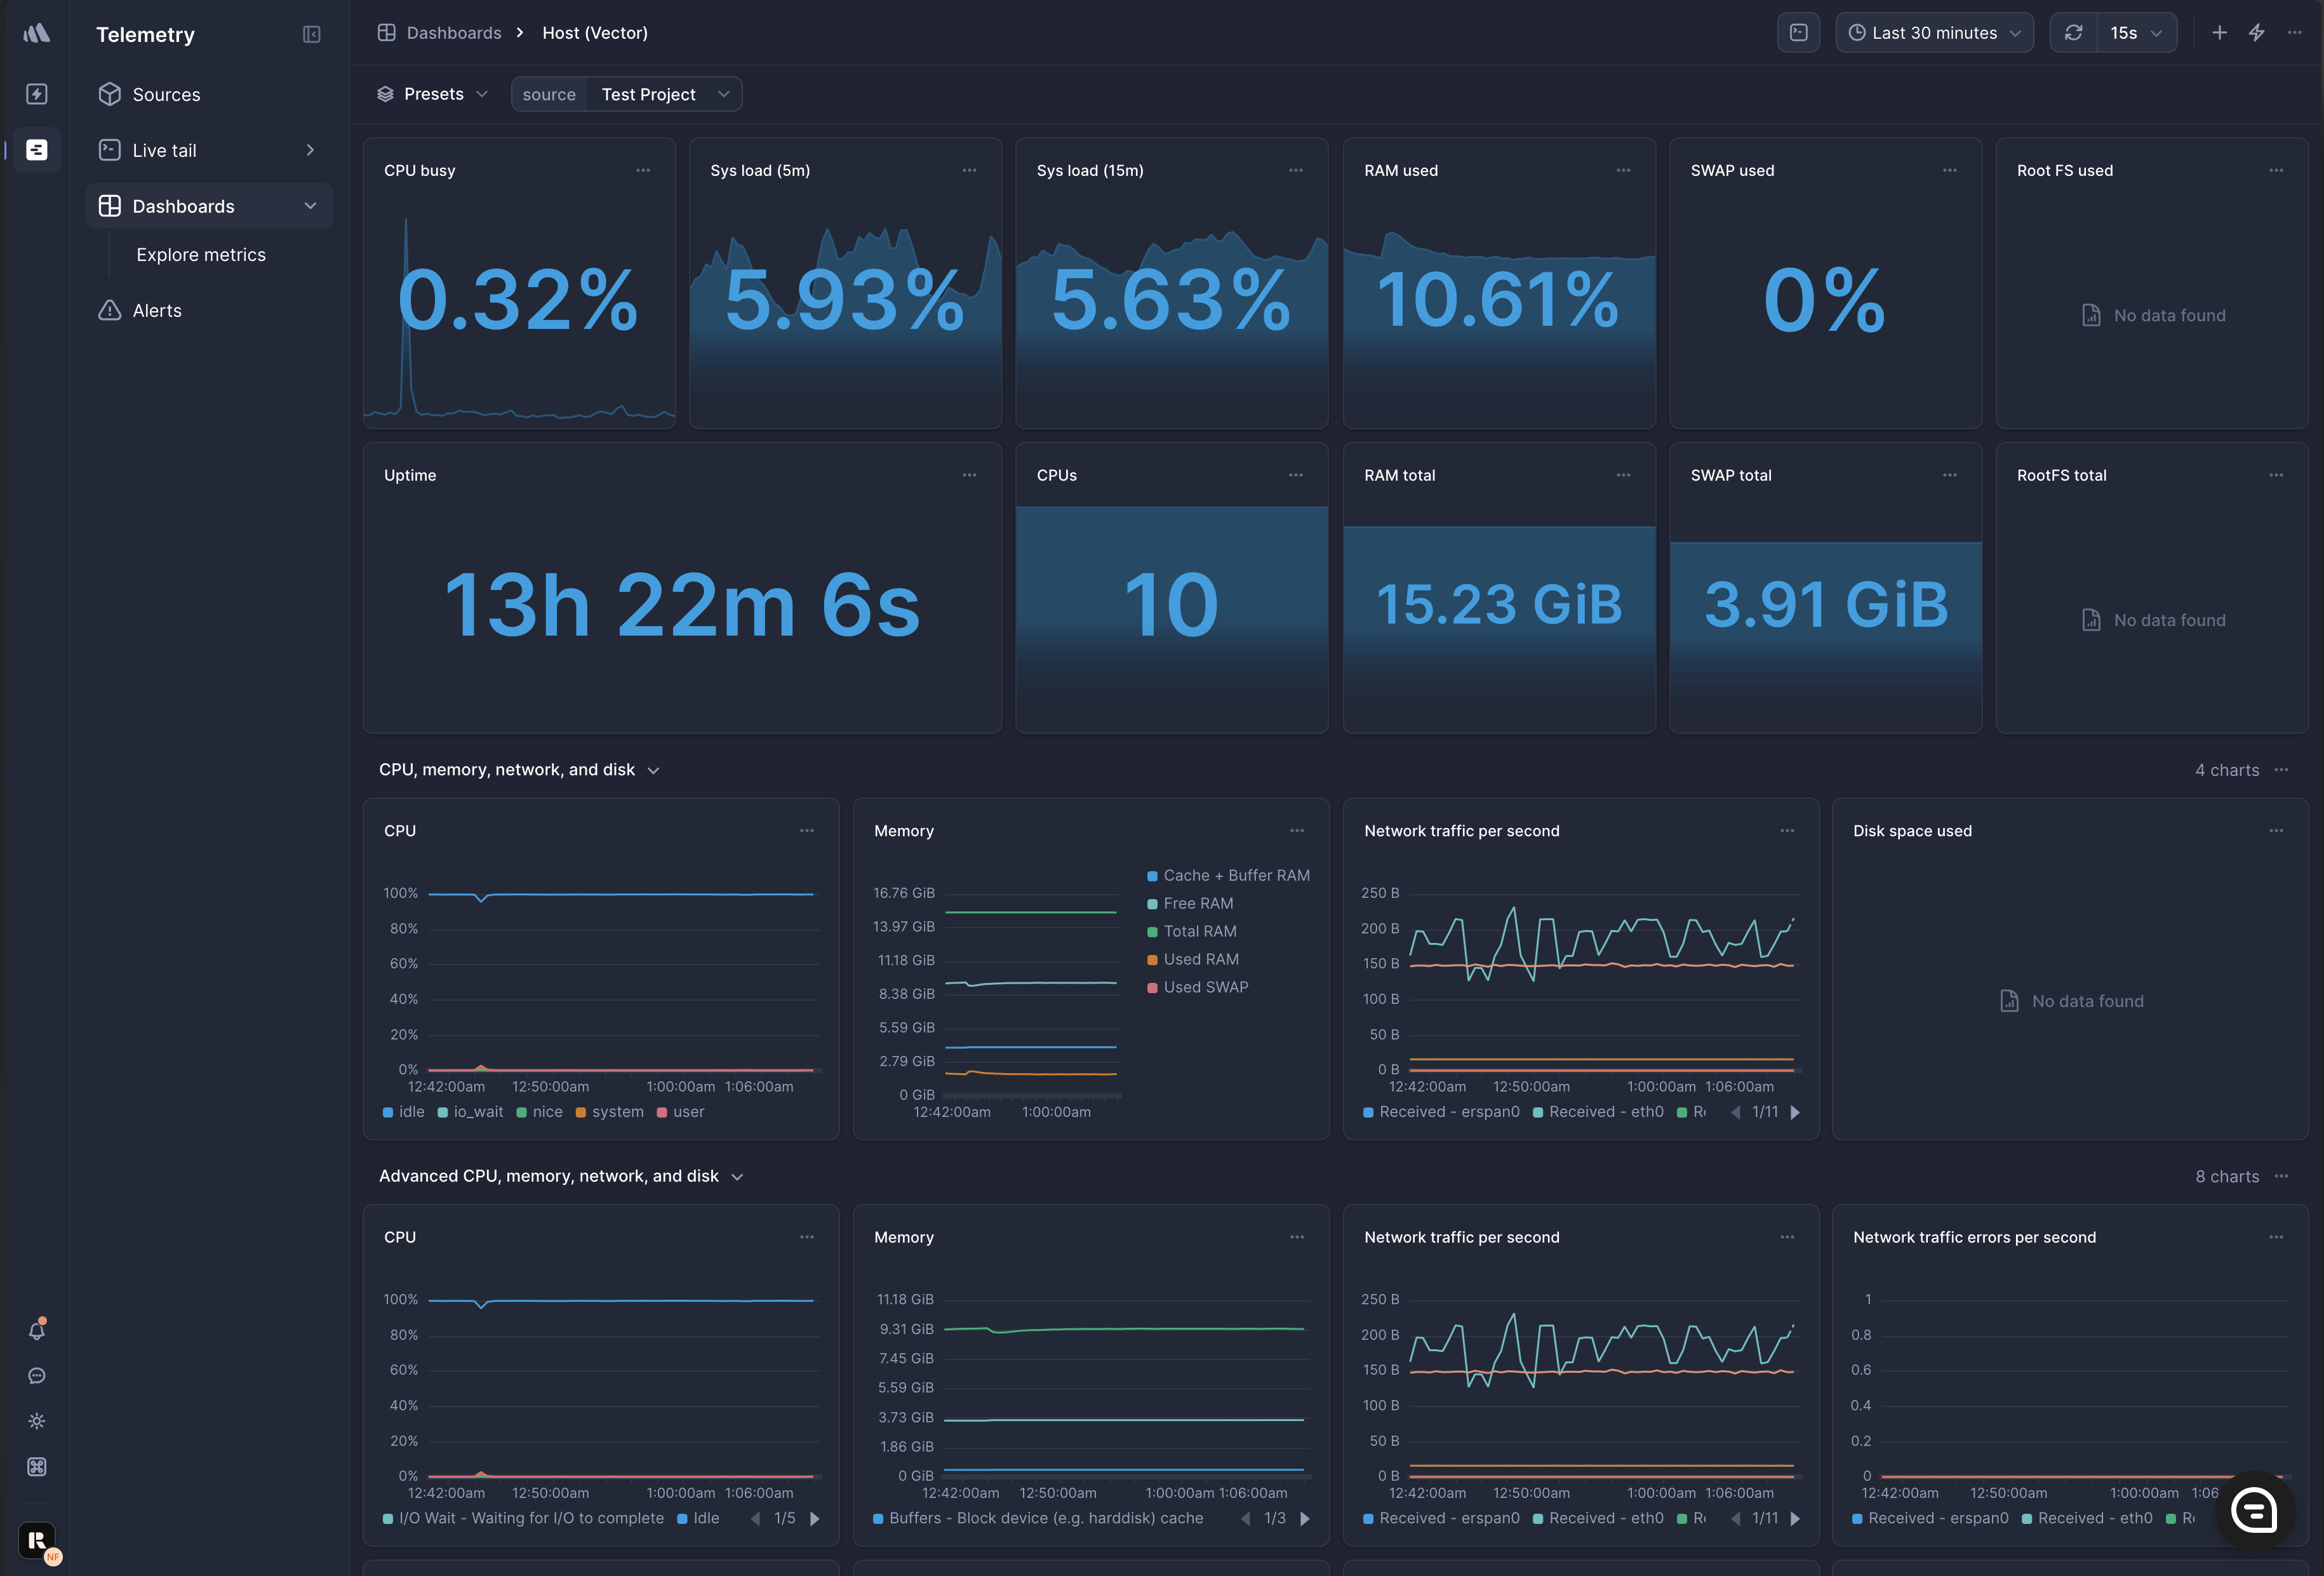
Creating Custom Dashboards
You can create custom dashboards to monitor your Actors by lobby ID:
- In your BetterStack dashboard, navigate to Dashboards
- Click Create dashboard
- Click Create chart
- Change the query type to SQL expression
- Write a custom SQL query using the lobby_id tag in the
GROUP BY(see examples below) - Save and configure your dashboard
Example: CPU Usage by Lobby ID
Here's an example SQL query to chart CPU usage by lobby ID:
Example: Memory Usage by Lobby ID
Here's an example SQL query to chart memory usage by lobby ID:
Troubleshooting
If you're not seeing logs or metrics in BetterStack:
- Verify your BetterStack token and host are correct
- Check that Vector is running properly by examining the Actor logs
- Ensure your application is writing to stdout/stderr
- Verify network connectivity from your Actor to BetterStack
Full Example Source Code
Source code for a full example can be found here.